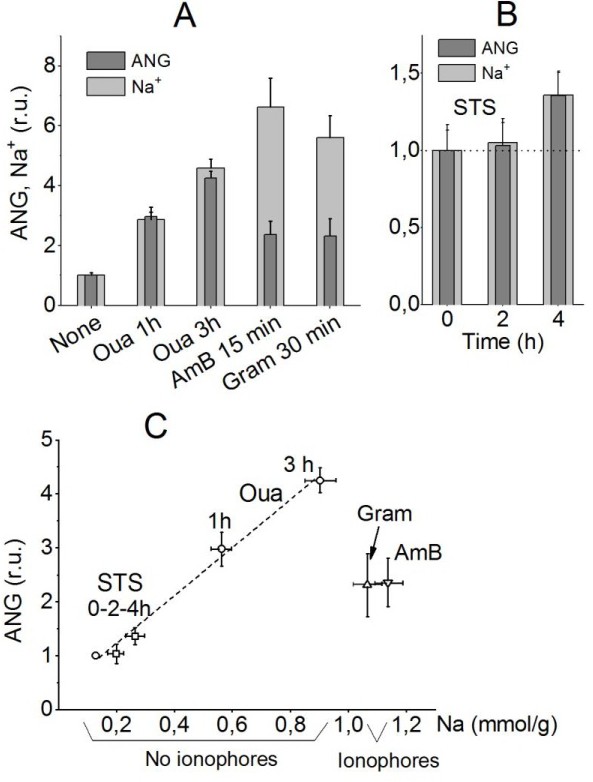
Fig. 6. Comparison of changes in ANG fluorescence and cellular Na+ by flame emission assay under various conditions. (A) Cells were treated with 10 µM ouabain, 5 µM Gram, or 15 µM AmB for the indicated times; (B) cells were treated with 1 µM STS to induce apoptosis; (C) ANG fluorescence at different Na+ concentrations obtained with and without ionophores. Other indications are on the graphs. Means ± SD were normalized to the values in untreated cells for 3-5 experiments (in duplicate for cellular Na+ content). The measured Na+ content in mmol/g cell protein corresponds to intracellular concentrations ranging from 34 to 154 mM.